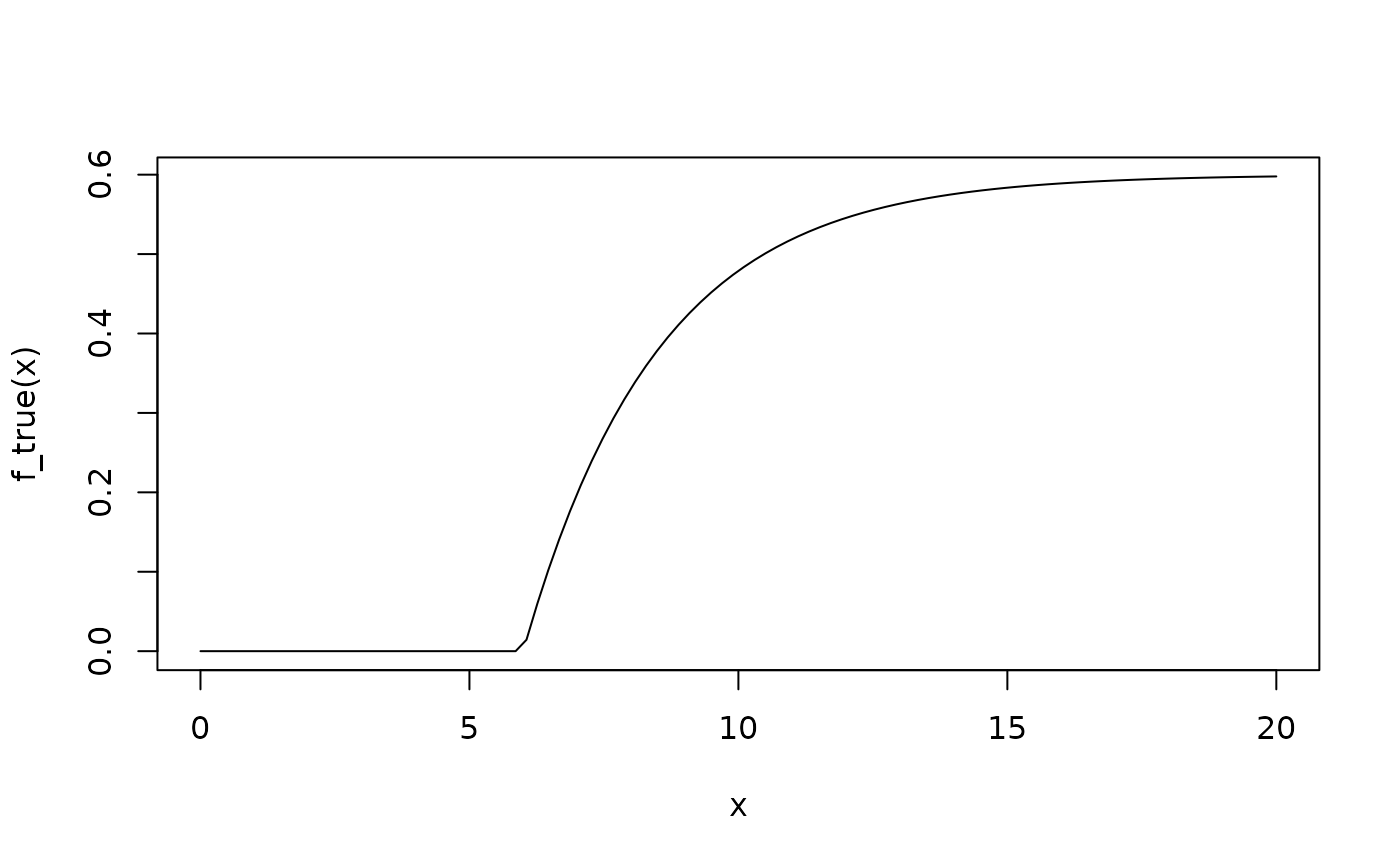
Saturating exponential beta * (1 - exp(-alpha * pmax(x - x_min, 0))).
This is the function the simulation tries to recover; it serves as the
ground truth in generate_aft_data() and is exported so users can
overlay it on plots.
Saturating exponential beta * (1 - exp(-alpha * pmax(x - x_min, 0))).
This is the function the simulation tries to recover; it serves as the
ground truth in generate_aft_data() and is exported so users can
overlay it on plots.